Data Visualization Using Tableau
Instructor: Avdhesh Gaur
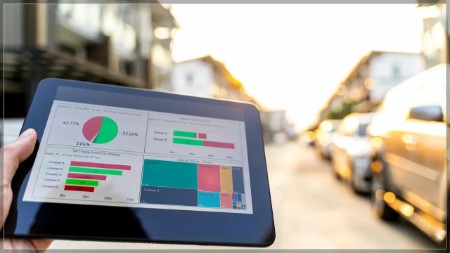
Tableau is one of the most powerful, easy use and widely accepted data analysis and visualization tools that do not provide handy data explanatory analysis capabilities but also provides a developer-friendly drag and drop interface to easily visualize your key findings.
Upon finishing this course, you’ll be a highly proficient Tableau user. You will not only learn how tableau works but also you will be able to understand “Why it works the way it works”.
You’ll be able to use your skills as a data analyst to extract relevant insights out of data by analysing & visualizing the same into useful KPI’s and presentable Tableau Dashboards.