

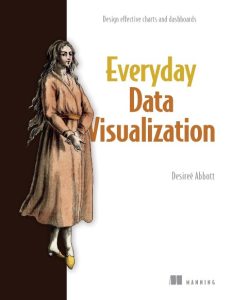

In Everyday Data Visualization you’ll learn important design principles for the most common data visualizations:
Harness the power of perception to guide a user’s attention Bring data to life with color and typography Design for interactive visualizations Keep the user’s needs first throughout your projects This book gives you the tools you need to bring your data to life with clarity, precision, and flair. You’ll learn how human brains perceive and process information, wield modern accessibility standards, get the basics of color theory and typography, and more.
About the technology
About the book
What’s inside
Bring data to life with color and typography Design interactive visualizations About the reader
For readers experienced with data analysis tools.
About the author
Desireé Abbott has over a decade of experience in product analytics, business intelligence, science, design, and software engineering.
The technical editor on this book was Michael Petrey.
Table of Contents
1 Hello, data viz!
2 How we perceive information
3 It’s all about the data
4 Choosing colors
5 Typography
7 Designing for interactivity
8 Research, design, and development
9 Troubleshooting
Appendix
Download