Quantitative Analysis Of Data Using Spss V29
Published 10/2024
MP4 | Video: h264, 1920×1080 | Audio: AAC, 44.1 KHz
Quantitative Analysis, SPSS Software, Tests and Conclusions
What you’ll learn
Explain the six SPSS windows and their specific uses.
Examine relationships using Scatter Plot and Scatter Plot Matrices.
Test for Normality and Homoscedasticity.
Explain numerical measures such as Central Location, Dispersion, Skewness, Kurtosis and Linearity.
Identify and differentiate between the different forms of outcomes.
Differentiate between the statistical types I and II errors.
Construct a multiple regression model, identify its elements and list its assumptions.
Learn to use the Ordinary Least Squares (OLS) regression method to estimate the coefficients.
Define the Standard Error of Estimates (SEE), explain its role in regression model and understand its visual representation.
Relate SEE to R-squared and the overall performance of the regression model.
Define ANOVA, explain its assumptions and significance in regression analysis, set its hypotheses, conduct ANOVA analysis using SPSS and explain its outcomes.
Formulate the null and alternative hypotheses.
Conduct a statistical T-test to assess and interpret the significance of the coefficients.
Define autocorrelation, identify its impact on regression models and test for autocorrelation using Durbin-Watson Test.
Explain the importance of forecasting time series data and perform a forecast seasonal time series data using SPSS V29.
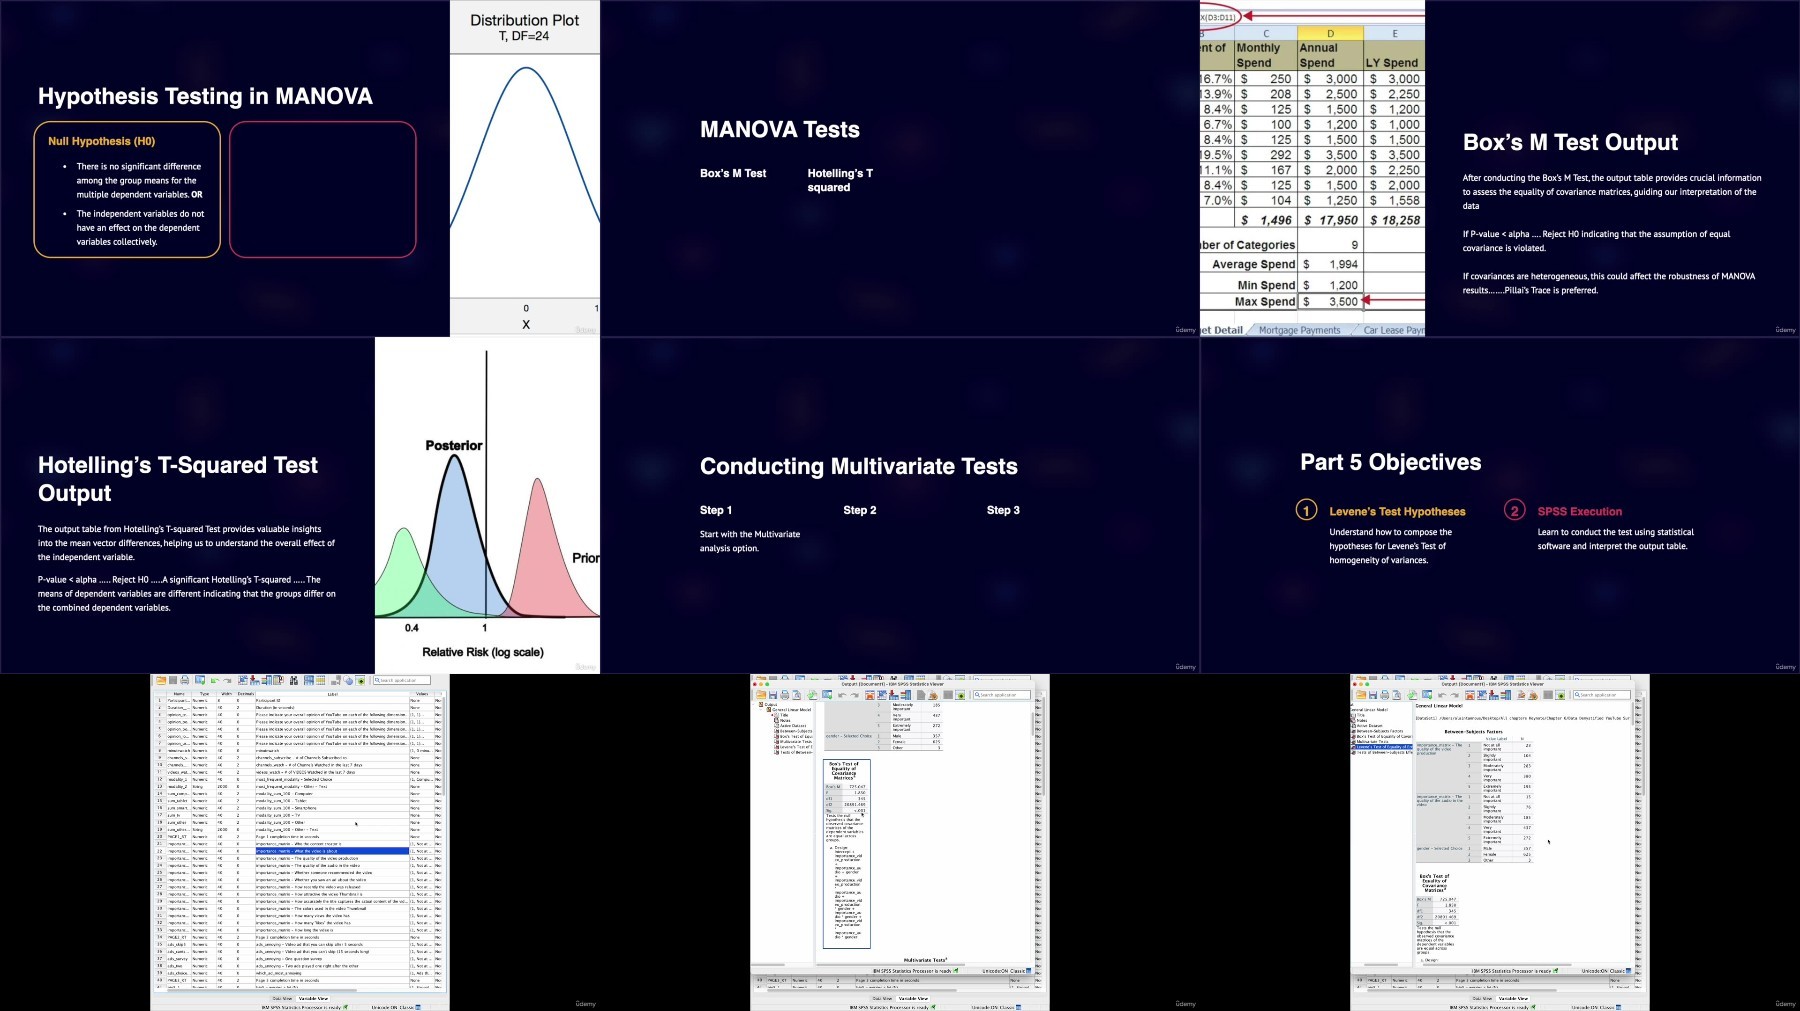
Define MANOVA, explain its assumptions and significance in regression analysis, set its hypotheses, conduct MANOVA test using SPSS and explain its outcomes.
Generate different tests related to MANOVA such as: Box’s M Test, Hotelling’s T Squared, Pillai’s Trace Test and Wilk’s Lambda Test.
Formulate and test the hypotheses of all MANOVA tests using SPSS.
Perform a stepwise discriminant analysis and analyze its outcomes using the cross-validation method.
Apply all tests using practical exercises on SPSS
Requirements
No prerequisites are required. You will learn all steps in this course.
Description
Overview
Section 1: Introduction & SPSS Basics
Lecture 1 Introduction
Lecture 2 Lesson 2.1 SPSS Basics
Section 2: Descriptive Statistics
Lecture 3 Descriptive Statistics
Lecture 4 Relationships
Lecture 5 Normality and Homoscedasticity
Lecture 6 Numerical Measures
Section 3: Hypotheses, Outcomes and Errors
Lecture 7 Null and Alternate Hypotheses
Lecture 8 Outcomes and Types of Errors
Section 4: Multiple Regression Model
Lecture 9 Multiple Regression Model and Assumptions
Lecture 10 Estimating the Coefficients
Lecture 11 Assessing the Model
Lecture 13 Testing and Interpreting the Coeficients
Lecture 14 Correlation of Errors: Durbin Watson Test
Lecture 15 Forecasting Seasonal Time Series
Section 6: Discriminant Analysis (DA)
Lecture 17 Discriminant Analysis in Statistics
Section 7: Logistic Regression (LR)
Lecture 18 Understanding Logistic Regression
Section 8: Principal Component Analysis (PCA)
Lecture 19 Principal Component Analysis (PCA)
Section 9: Factor Analysis
Lecture 20 Factor Analysis (FA)
Section 10: Cluster Analysis (CA)
Lecture 21 Cluster Analysis (CA)
Graduate and Postgraduate students who are engaged in writing their thesis or dissertation which is based on a quantitative analysis of data.,Beginner researchers who require a tool to analyze their findings.