

Technical Analysis with Python for Algorithmic Trading
Use Technical Analysis and Indicators for (Day) Trading. Create, backtest and optimize TA Trading Strategies with PythonWhat you’ll learn
Make proper use of Technical Analysis and Technical Indicators.
Use Technical Analysis and Indicators for (Day) Trading. Create, backtest and optimize TA Trading Strategies with PythonWhat you’ll learn
Make proper use of Technical Analysis and Technical Indicators.
Use Technical Analysis for (Day) Trading and Algorithmic Trading.
Convert Technical Indictors into sound Trading Strategies with Python.
Backtest and Forward Test Trading Strategies that are based on Technical Analysis/Indicators.
Create and backtest combined Strategies with two or many Technical Indicators.
Visualize Technical Indicators and Trend/Support/Resistance Lines with Python and Plotly.
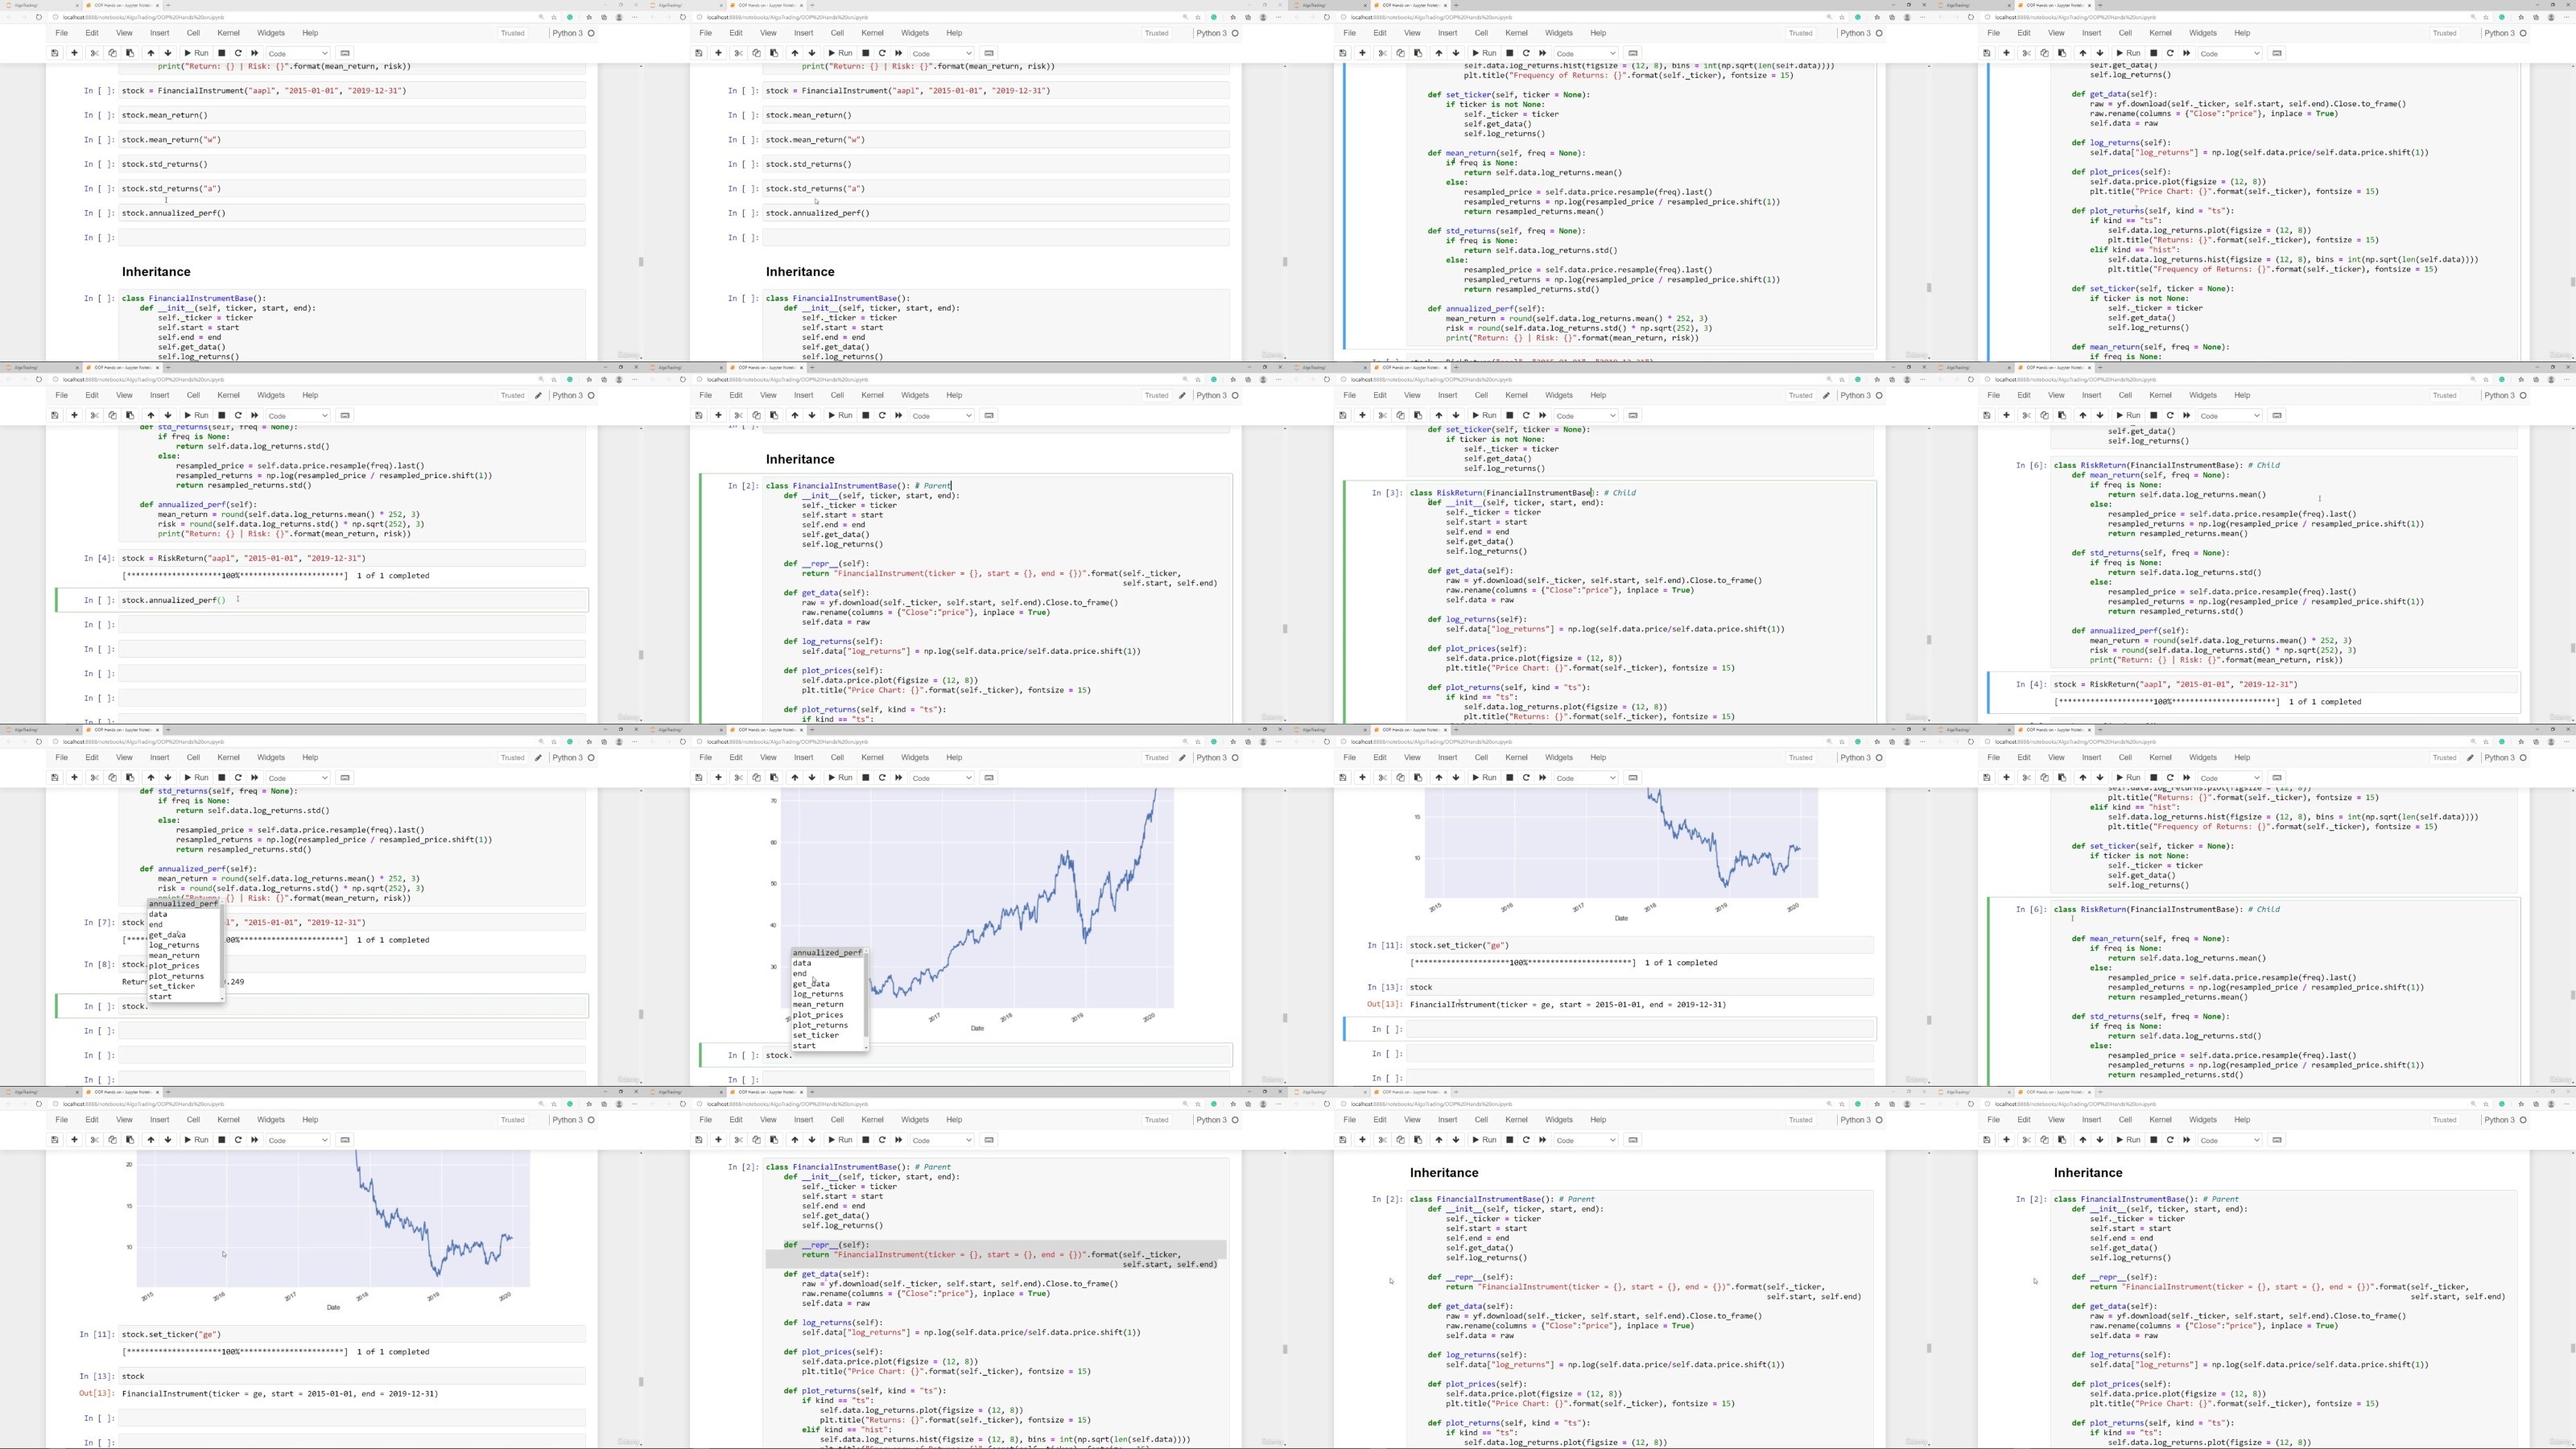
Use Pandas, Numpy and Object Oriented Programming (OOP) for Technical Analysis and Trading.
Load Financial Data from local files and the web.
Simple Moving Average (SMA) strategies
Exponential Moving Average (EMA) strategies
Moving Average Convergence Divergence (MACD) strategies
Relative Strength Index (RSI) strategies
Stochastic Oscillator strategies
Bollinger Bands strategies
Pivot Point strategies
Fibonacci Retracement strategies
mixed strategies (combining two or many indicators)
Description
"(How) Can I use Technical Analysis and Technical Indicators for Trading and Investing?" – This is one of the most frequently asked questions in trading and investing.
This course will allow you to test and challenge your trading ideas and hypothesis. It provides Python Coding Frameworks and Templates that will enable you to code and test thousands of trading strategies within minutes. Identify the profitable strategies and scrap the unprofitable ones!
The course covers the following Technical Analysis Tools and Indicators:
Trend, Support and Resistance Lines
Simple Moving Average (SMA)
Exponential Moving Average (EMA)
Moving Average Convergence Divergence (MACD)
Relative Strength Index (RSI)
Stochastic Oscillator
Bollinger Bands
Pivot Point (Price Action)
Fibonacci Retracement (Price Action)
combined/mixed Strategies and more.
This is not only a course on Technical Analysis and Trading. It´s an in-depth coding course on Python and its Data Science Libraries Numpy, Pandas, Matplotlib, Plotly, and more. You will learn how to use and master these Libraries for (Financial) Data Analysis, Technical Analysis, and Trading.
As always, there is no risk for you as I provide a 30-Days-Money-Back Guarantee.
Thanks and looking forward to seeing you in the Course!
Who this course is for:
(Day) Traders and Investors who want to make proper use of Technical Analysis.
(Day) Traders and Investors who want to professionalize their Business.
RapidGator
https://www.keeplinks.org/p27/67c68ac321301
NitroFlare
AlfaFile
https://www.keeplinks.org/p27/67c68bbace2c0
FileFactory