

Two-Way ANOVA in Minitab – Tabtrainer® for Manufacturing
Last updated 5/2025
Duration: 1h 1m | .MP4 1280×720, 30 fps(r) | AAC, 44100 Hz, 2ch | 431 MB
Analyze pressure & roughness effects in Minitab – apply Two-Way ANOVA with interaction and Tukey test to optimize.
What you’ll learn
– Visual Exploration of Data: Use boxplots and main effect plots to visually identify preliminary trends, interactions, and possible effects.
– Interpreting: Interpret p-values (< 0.05) to identify meaningful main and interaction effects between laminating pressure and surface roughness.
– Main Effects vs. Interaction Effects: Differentiate between independent main effects and interaction effects.
– Factorial Interaction Plots: Create and interpret factorial plots to clearly visualize significant interactions between categorical factors.
– Tukey Post-hoc Analysis: Apply the Tukey test to determine exactly which factor combinations significantly differ from each other.
– Evidence-based Production Recommendations: Translate statistical insights into practical decisions, recommending optimal factor settings.
Requirements
– No Specific Prior Knowledge Needed: all topics are explained in a practical step-by-step manner.
Description
Welcome to this expert-level training from theTabtrainer® Certified Series- your trusted platform for applied statistical modeling in manufacturing.
From raw data preparation and model diagnostics to graphical interpretation and business optimization, this training builds your skills to evaluate complex processes with confidence.
Students follow a structured learning process:
Visual Analysis: Usingboxplotsandmain effects plotsto explore initial trends and identify possible interaction effects between predictors.
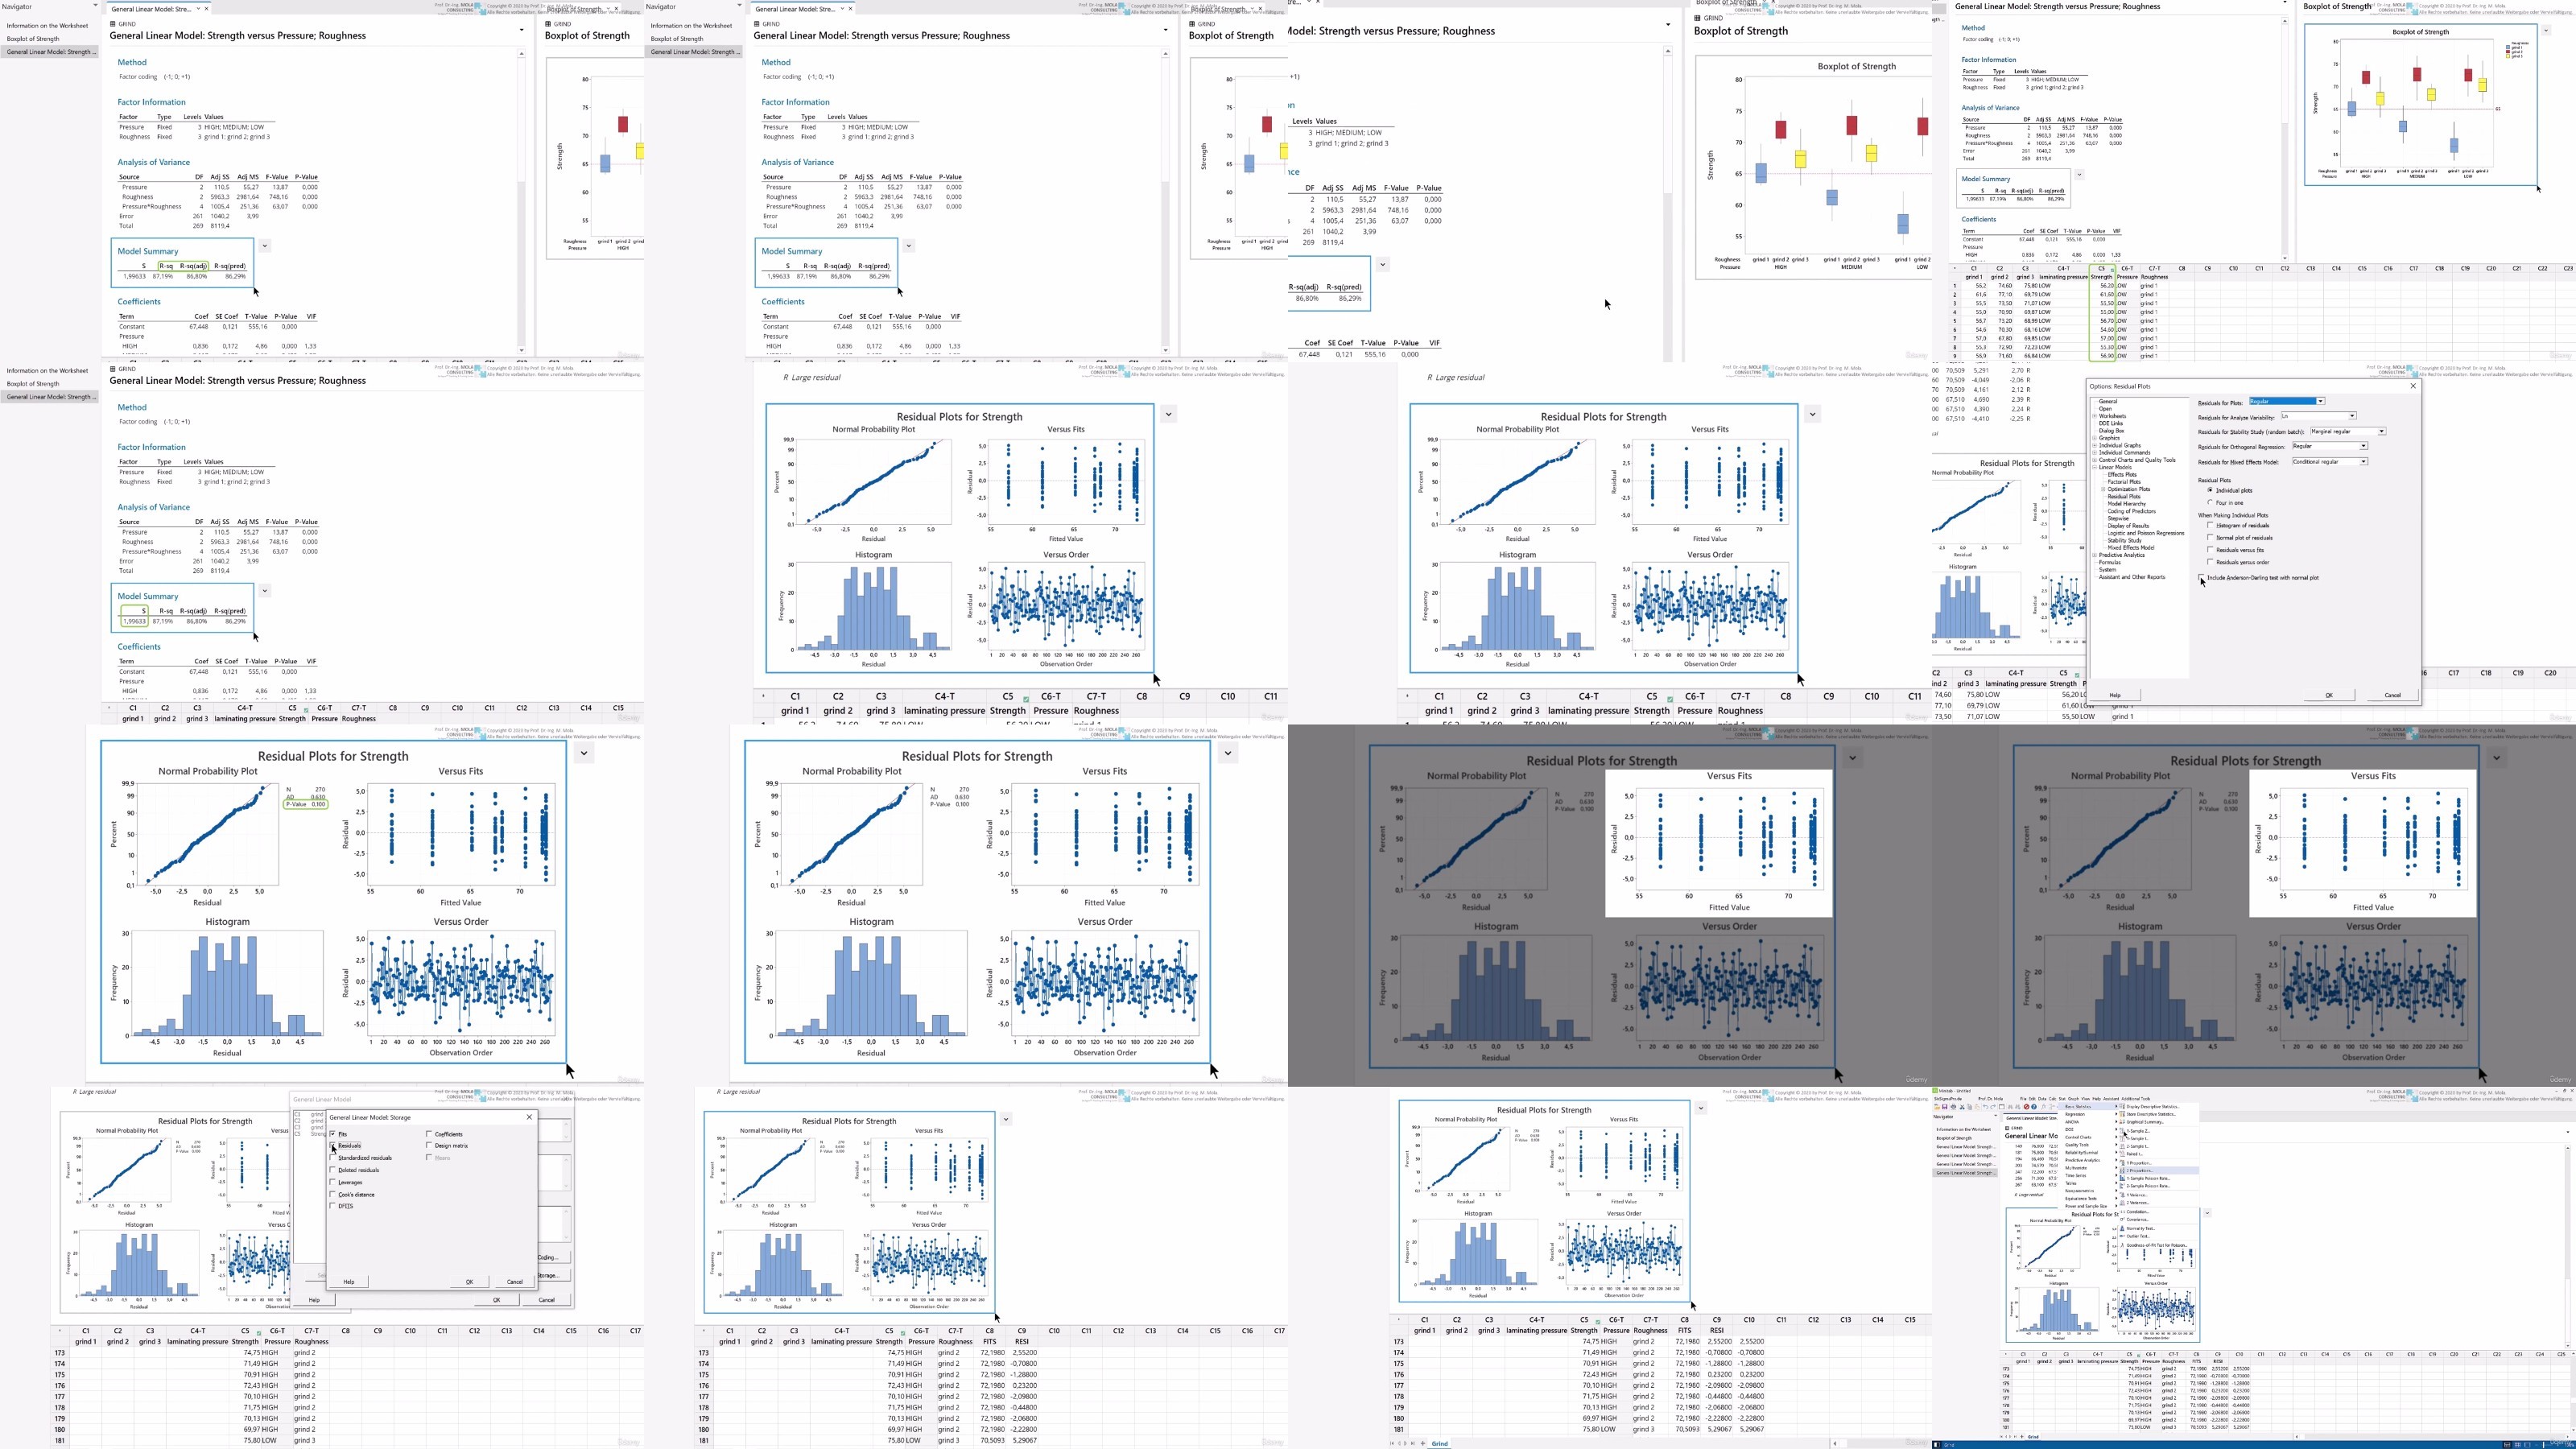
Statistical Modeling: Performing a two-way ANOVA with interaction terms using the General Linear Model (GLM), interpretingp-values, and understanding the logic behindmain effectsandinteraction effects.
Model Diagnostics: Evaluating model quality with R-squared and residual analysis; confirming the normal distribution of residuals with a 4-in-1 plot and the Anderson-Darling test.
Post-hoc Testing: Applying theTukey significance testto identify which specific combinations of pressure and roughness lead to significantly different strength outcomes.
Business Interpretation: Drawing conclusions about which parameter settings deliver the most stable and high tensile shear strength, and recommending optimized production configurations based on statistical evidence.
By the end of the training, students are able to:
Build and interpret a Two-Way ANOVA model.
Understand and distinguish betweenmain effectsandinteraction effects.
Apply residual diagnostics to evaluate model fit.
UseTukey grouping lettersand confidence intervals to validate significant factor combinations.
Translate statistical results intoconcrete optimization strategiesin an industrial environment.
Who this course is for:
– Quality Assurance Professionals: Those responsible for monitoring production processes and ensuring product quality will gain practical tools for defect analysis.
– Production Managers: Managers overseeing manufacturing operations will benefit from learning how to identify and address quality issues effectively.
– Six Sigma Practitioners: Professionals looking to enhance their expertise in statistical tools for process optimization and decision-making.
– Engineers and Analysts: Individuals in manufacturing or technical roles seeking to apply statistical methods to real-world challenges in production.
– Business Decision-Makers: Executives and leaders aiming to balance quality, cost, and efficiency in production through data-driven insights and strategies.
More Info
Please check out others courses in your favourite language and bookmark them
– – – –
DDownload
https://www.keeplinks.org/p27/683a08e68ff65
https://ddownload.com/bevy5ixgc4vs/yxusj.Two-Way.ANOVA.in.Minitab.-.Tabtrainer%C2%AE.for.Manufacturing.rar
RapidGator
https://www.keeplinks.org/p27/683a0913b97e7
https://rapidgator.net/file/a6cd3cdc2275963796fe6d6ded520173/yxusj.Two-Way.ANOVA.in.Minitab.-.Tabtrainer®.for.Manufacturing.rar
NitroFlare
https://nitroflare.com/view/4142D8EE471C9F3/yxusj.Two-Way.ANOVA.in.Minitab.-.Tabtrainer%C2%AE.for.Manufacturing.rar